

A digital recording is a list of samples, and the loudest sample isn’t the loudest point of the sound. The wave runs between the samples, and between two of them it can rise higher than either. Sample peak is the biggest number in the file. True peak is the biggest value of the wave, and it’s the one the streaming services and broadcasters put a ceiling on, because it’s what clips a converter or an encoder on the way out. I measured how well a meter can find it while building this site’s loudness normaliser, which uses it as the ceiling.
A word on the units, since the whole note is in them. Levels here are in decibels, dB. A change of 1 dB is about the smallest step in level most people can hear; 3 dB is a clear step; a tenth of a decibel is something only a meter can tell apart, which is why the standards set their tolerances in tenths. Negative numbers are levels below full scale, the loudest a digital file can hold.
Three decibels between two samples
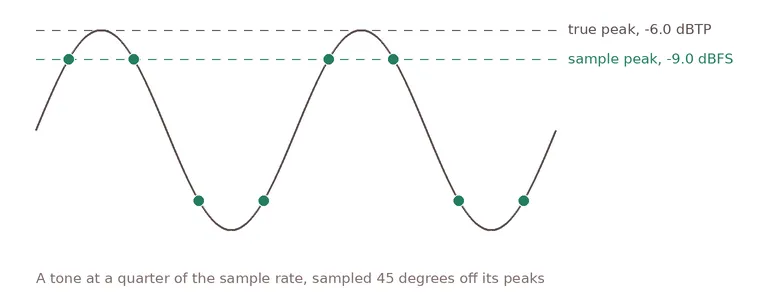
The clearest case is a tone at a quarter of the sample rate, 12 kHz at 48 kHz, sampled 45 degrees off its peaks. Every sample then lands at 71% of the wave’s height, so the samples say -9.03 dBFS while the wave reaches -6.02. A meter that reads the samples is 3 dB wrong on a signal that couldn’t be simpler.
On real recordings the gap is smaller but it’s there. Of four recordings I measured, decoded to 48 kHz (a backing track and a drum loop from MP3, a piano track from FLAC, a guitar lesson), the backing track’s wave peaks 0.09 dB above its loudest sample, at +0.98 dBTP, which is to say over full scale: a hot MP3 decodes to a wave the samples couldn’t hold. The piano’s wave sits 0.015 dB above its samples, and the loop and the guitar peak exactly on a sample. The gap depends on what’s in the top octave; cymbals and synths put more there than a piano does.
How a meter finds the wave
The standard, ITU-R BS.1770, says to oversample by four: work out three in-between values for every gap between samples, each a weighted blend of the samples around it, and take the largest of everything. The filter doing the blending is described by how many neighbouring samples it uses, its taps. The standard’s annex gives an example with 12 taps per in-between point and allows longer ones. Two things limit how close this gets to the true peak, and they’re worth keeping apart.
The grid. Four times oversampling is still a grid, and a peak that falls exactly between two of its points is read low by an amount that grows with frequency: by 0.17 dB at 12 kHz and 0.47 dB at 20 kHz for a lone peak, which is why the EBU’s test for a 4x meter allows 0.4 dB under and 0.2 dB over. A steady tone drifts across the grid from cycle to cycle and is caught; a single transient may not be.
The filter. A short blending filter doesn’t treat all frequencies equally: it quietly turns the top of the range down, and a quieter top octave means a peak that’s read low. I measured five designs of the same shape, with 12 to 32 taps and two kinds of window (the window is the shape that tapers the filter’s ends), against the ideal reading from the same 4x grid. Tones at seven frequencies, each stepped through 240 phases, reading only the interior of the tone, because a tone switched on at full level rings between its samples and that ringing is real; my first run read a 1 kHz tone 1 dB over for exactly that reason.
- 12 taps, the standard’s example shape
- 24 taps, this meter
| Filter, taps per point | 12 kHz | 15 kHz | 18 kHz | 20 kHz |
|---|---|---|---|---|
| 12, Blackman window | -0.005 | -0.07 | -0.52 | -0.30 |
| 12, Kaiser 4.0 | +0.07 | -0.02 | +0.10 | -0.30 |
| 16, Kaiser 5.0 | +0.002 | +0.01 | +0.04 | -0.26 |
| 24, Kaiser 5.65 | 0.000 | -0.003 | +0.002 | +0.02 |
| 32, Kaiser 7.0 | 0.000 | 0.000 | +0.002 | +0.002 |
Worst case in dB, negative reading low; up to 10 kHz every design is within 0.01 dB except the 12-tap Kaiser, which reads up to 0.06 high. The 12-tap designs lose half a decibel at 18 kHz and a third at 20. The reason is in how much they turn the top down: at 20 kHz, the 12-tap Blackman filter’s half-sample point has a gain of -2.9 dB, where the 24-tap design’s is +0.02.
Noise shows the same thing on something closer to real programme. On the pink-shaped noise this site’s test driver uses, whose true peak sits 0.35 dB above its loudest sample, the 12-tap Blackman filter read 0.16 dB under an exact reference (16 times oversampling with a 128-tap filter), the 16-tap 0.08 under, the 24-tap 0.04 under and the 32-tap 0.02. The normaliser uses the 24-tap design: on every tone it errs high if at all, which is the right side for a figure that sets a ceiling, and it costs nothing you can feel, two minutes of stereo measured in a quarter of a second.
On the four recordings every one of the five filters read within 0.01 dB of the exact reference, because their peaks sit on or near a sample. The filter matters on material whose peaks live between samples and in the top octave.
Checked against FFmpeg
FFmpeg’s loudnorm filter reports true peak in hundredths, and on the four
recordings it read +0.97, +0.68, -1.31 and -2.10 dBTP, against this meter’s
+0.98, +0.68, -1.31 and -2.10. For loudness, its ebur128 filter read
-12.1, -19.1, -20.4 and -17.4 LUFS against this meter’s -12.09, -19.10,
-20.43 and -17.40. One thing I didn’t expect: FFmpeg’s two filters don’t
agree with each other. On the same two minutes of piano, loudnorm
measured -19.97 LUFS where ebur128 measured -20.4, and the four files
differ by up to 0.46 LU between the two. This meter sits with ebur128,
the dedicated R 128 meter, on all four.
Checked against the standard’s own signals
Loudness meters have an answer key: the EBU’s Tech 3341 test signals, whose correct readings are published, with 0.1 LU of tolerance. This meter reads them at -22.99, -32.99, -23.01, -23.01 and -22.98 LUFS for cases one to five, all of which should read -23.0 except the second, which should read -33.0; the first case at 44.1 kHz reads -22.99, from filter coefficients computed for that rate rather than the 48 kHz ones the standard prints.
The filter, in code
The whole interpolator is a windowed sinc per phase, normalised so a steady level stays put. This is the 24-tap design.
import numpy as np

def phase(frac, taps=24, beta=5.65):
    """One 4x interpolation point: a windowed sinc centred frac of a sample late."""
    half = taps // 2
    t = np.arange(taps) - (half - 1) - frac
    window = np.i0(beta * np.sqrt(1 - (t / half) ** 2)) / np.i0(beta)
    h = np.sinc(t) * window
    return h / h.sum()  # unity gain at DC

phases = [phase(f) for f in (0.25, 0.5, 0.75)]
Run each phase over the samples, take the largest absolute value of the three results and of the samples themselves, and that’s the true peak. The difference between a meter that’s 0.5 dB wrong at the top of the band and one that isn’t is twelve numbers and a window.
What to take from it
Sample peak isn’t a safe ceiling: the wave between samples can be 3 dB higher on a pure tone and a tenth of a decibel higher on an ordinary recording, and either is enough to clip. A true-peak reading is a 4x oversampled estimate, allowed 0.4 dB under by the standard, and most of that allowance is the grid rather than the filter. A meter with a short filter spends the allowance on material with treble; a longer filter leaves it unspent. And a reading of +0.98 dBTP on an MP3 isn’t a bug in the meter.